Holiday energy consumption: what to look for after a holiday
We often talk about preparing switch-off lists to help you cut energy costs during the holiday. Here, Nikki Webb explains how you can use Energy Sparks to see whether your holiday energy use matched your expectations, or whether you need to investigate further…
At Energy Sparks we talk a lot about preparing for holidays. Holidays make up about a quarter of the school year and even those schools with external lettings and holiday use will very rarely operate at full capacity.
This makes holidays a really big opportunity for making savings by switching off anything that isn’t absolutely necessary.
But we also recommend checking back after the holidays so see what impact your preparation has had.
It’s great to be able to celebrate successes – and holidays can give you things to celebrate very quickly rather than having to wait until a whole year’s comparison is possible. But if you haven’t made the savings you had hoped for, it could indicate underlying problems…and identifying this is your first step to solving it!
So what is the best way to check for holiday savings?
(Do you work for a Multi-Academy Trust or Local Authority?
click here for advice on where to look.)
1. Directly compare last year’s holiday with this year’s
If you are signed up for Energy Sparks alert emails, you might receive one that looks something like the green box below (Bristol Cathedral Choir School worked really hard to get their electricity use down this year).
In the week or two after a holiday, you can also find these alert messages on your adult and pupil dashboards or by clicking on the View more alerts link.

The Find out more link in the alert will take you to the holiday analysis in your Out of hours advice page. There will be one of these for electricity and one for gas – depending on data availability.
This section has a 14 month chart to allow for visual comparison between the most recent holiday and the same holiday last year (lovely job below by Bentley High Street Primary School).
It also has a table showing energy consumption as well as related carbon dioxide emissions and cost for all the holidays over the last two years (again, where data availability allows).

2. Make sure there is a noticeable change in energy use between term time and holidays
A school will still use some electricity to power fridges, freezers, servers and security systems – even if the school is completely empty (although we do recommend emptying or consolidating fridges and freezers for long holidays).
The very best schools with little holiday use will use about 25% as much electricity per week during the holidays as during term time.
For gas, it’s going to be slightly more complicated. Gas might still be used for heating hot water (although it shouldn’t need to be heated 24 hours a day unless your school has increased legionella risks), for heating a swimming pool, or to protect pipes from freezing in winter.
What you don’t want is for your charts to look like the one below. This shows that the same amount of gas is being used during the holidays (red bars) as during term time. The amount of gas used each week is tracking the degree days line, meaning that more gas is being used when it’s colder. Remember: during the holidays, you only need enough heat to protect your buildings and pipes – it doesn’t need to be comfortable for people if there’s nobody in!

3. Take a closer look
If more energy is used during the holidays than you expect, have a quick look at when it is used. You can do this by clicking on a week of the holidays to see how much gas or electricity is used each day.
The chart below shows gas consumption on Christmas week. Notice how little or no gas is used during the weekend, but during the week it is higher. This suggests the heating has been left on “term time” mode.

Clicking onto one of those days shows gas use during that day. If it looks like the chart below, it suggests the heating is still set for when students are in school.

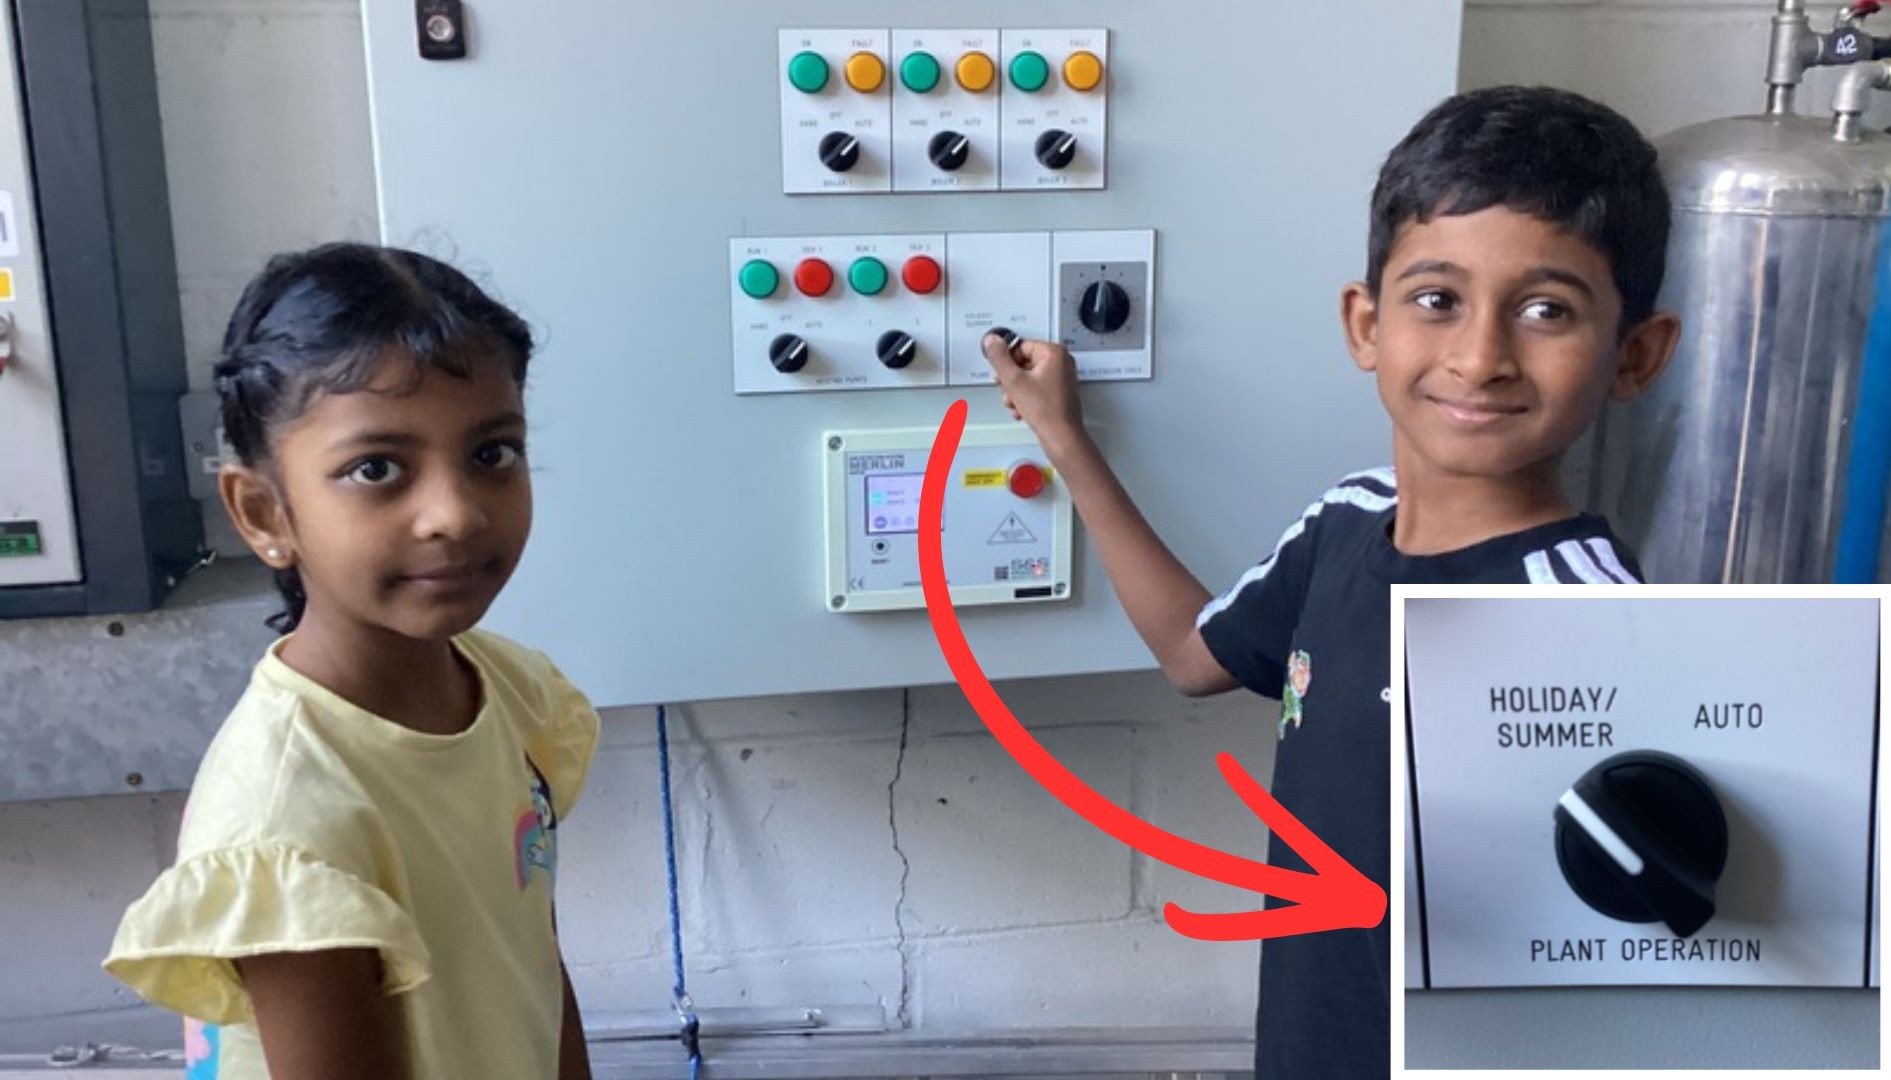
Many heating systems will have a simple holiday setting, which will ensure that heating only comes on if absolutely necessary. Many thanks to Horsford Primary – Holt Road for sharing this picture of their students getting involved in switching things off for the holidays.
If your school doesn’t have this setting, you should be able to reduce set temperatures instead. See our frost protection guidance for more details.

We often see very similar patterns with electricity. This suggests something with a timer is still timed to go on and off during the week. Think hot water boilers, immersion heaters, lighting and even computers.
4. Do some direct comparisons
Some of the charts in Energy Sparks allow comparisons between energy used on two different days or weeks (you can choose which days/weeks you want to compare). These can be found on the recent changes advice pages and on the pupil dashboard.
The chart below compares the electricity used between Christmas week 2023 and Christmas week 2025. Users can choose whether to compare cost, carbon dioxide emissions or kWh of energy used. If your school has spent £250 more on electricity on Christmas Day alone, you will want to look into why.

The chart below shows electricity consumption Christmas Day 2024 compared to Christmas Day 2025. This shows that not only was something timed to switch on in the morning and off in the afternoon, but that the overnight electricity consumption was also much higher.

It’s really useful to pick a day when you know there was no one in the school. Many schools will find this difficult with external lettings, holiday clubs or leisure centres on site. But even those schools are usually completely empty on Christmas Day and Easter Sunday.
5. Don’t forget your electricity baseload
Another thing we talk about a lot at Energy Sparks is electricity baseload – the electricity needed to provide power to appliances that keep running at all times. If a school’s baseload changes, it can have a big impact on the amount of electricity being used in the school (and therefore energy bills, as electricity is very expensive).
Holidays often make the impact of those changes more obvious. A tiny change in baseload may cause your holiday costs to increase by hundreds of pounds. We wrote a blog about this a couple of years ago.
There is also the opportunity to spot savings made during a holiday switch off and find a way to replicate this all year round. For example, by finding an inefficient freezer.
6. Think about what this all means!
If you’ve spotted electrical items coming on automatically, make a list of what they might possibly be. Think about the size of the consumption (I like to relate things to kettles, which use 2-3kW) and whether it uses the same amount all the time.
Creating heat uses a lot of energy, so if your school is using a lot of electricity during holidays, rule out anything that uses electricity for heat first. If the amount of electricity being used fluctuates, rather than staying at a flat level, it is likely working to a thermostat. Think about your fridge at home making a lot of noise (using a lot of energy) when it is working hard to get cool.
Add a reminder to your switch off list to change the settings on anything with a timer at the end of term.
For gas (or heating in general), check your settings as closely as you can. If it’s not immediately obvious why the heating has come on, there may be something more nuanced within the settings (or something not working correctly).
For example:
One Energy Sparks school found that their heating kicked in if key locations around the school got too cold. The heating had been switched off in one classroom all year because the teacher found it too warm and this classroom turned out to be one of those key locations. The heating in that classroom never turned on during the holidays, and because that room was always cold, the heating was always on.
A number of schools over the last year have found that new heating zones or hot water systems haven’t been connected to the school’s Building Energy Management System (BEMS), despite looking like they were. All the settings looked like they were working, but the heating and hot water were on permanently.
7. Multi-Academy Trusts and Local Authorities – look at your group comparisons report
If you work for a MAT or Local Authority and have an Energy Sparks account, take a look your group comparisons page, where you can view reports that show changes in holiday consumption between the most recent holiday and the previous one, or the most recent and the same holiday last year for schools across your group. If you want to delve deeper into the detail for your schools – the rest of this article explains what to look for after a holiday.
Don’t struggle alone:
If you find something that you don’t understand – an unexplained increase or an exciting but unexplained saving – and you would like some help to work out what’s happening, you can always get in touch. Email us at support@energysparks.uk.